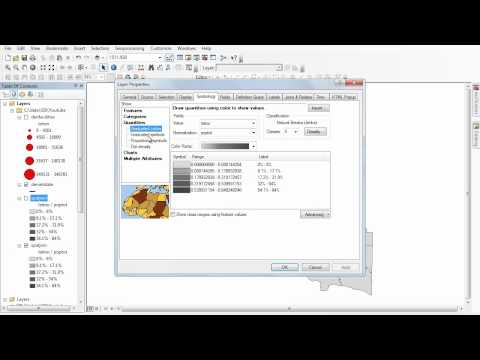
This tutorial shows you how we can overlay two shapefiles in order to view two variables at once. In this example, the top shapefile is formatted using dot density and the bottom shapefile is formatted using graduate colors.
GIS
This tutorial shows you how we can overlay two shapefiles in order to view two variables at once. In this example, the top shapefile is formatted using dot density and the bottom shapefile is formatted using graduate colors.


0 Comments